
Visitor statistics are a vital metric for measuring success and understanding your audience. However, it's simply impossible to get data when it comes to PDF documents, files, or other basic online services. With the Heyzine Professional Plan, it can't be easier to understand your reader's behavior.
You can find out the number of visits and visitors over time, the duration of the visits, all the interactions, links, and hotspots clicked on a document, the website and location your readers come from, and much more information.
Let's see what data you can extract from each of the sections of the statistics
page.
- Where can I find the stats of my documents?
- How do I view stats per page?
- How do I know where my visitors are coming from?
- How do readers interact with my documents?
- How can I export the data?
- How can I define the time zone used in the reports?
Where can I find the stats of my documents?
Very easy. Just log in to your account and go to the stats icon at the top of the dashboard:

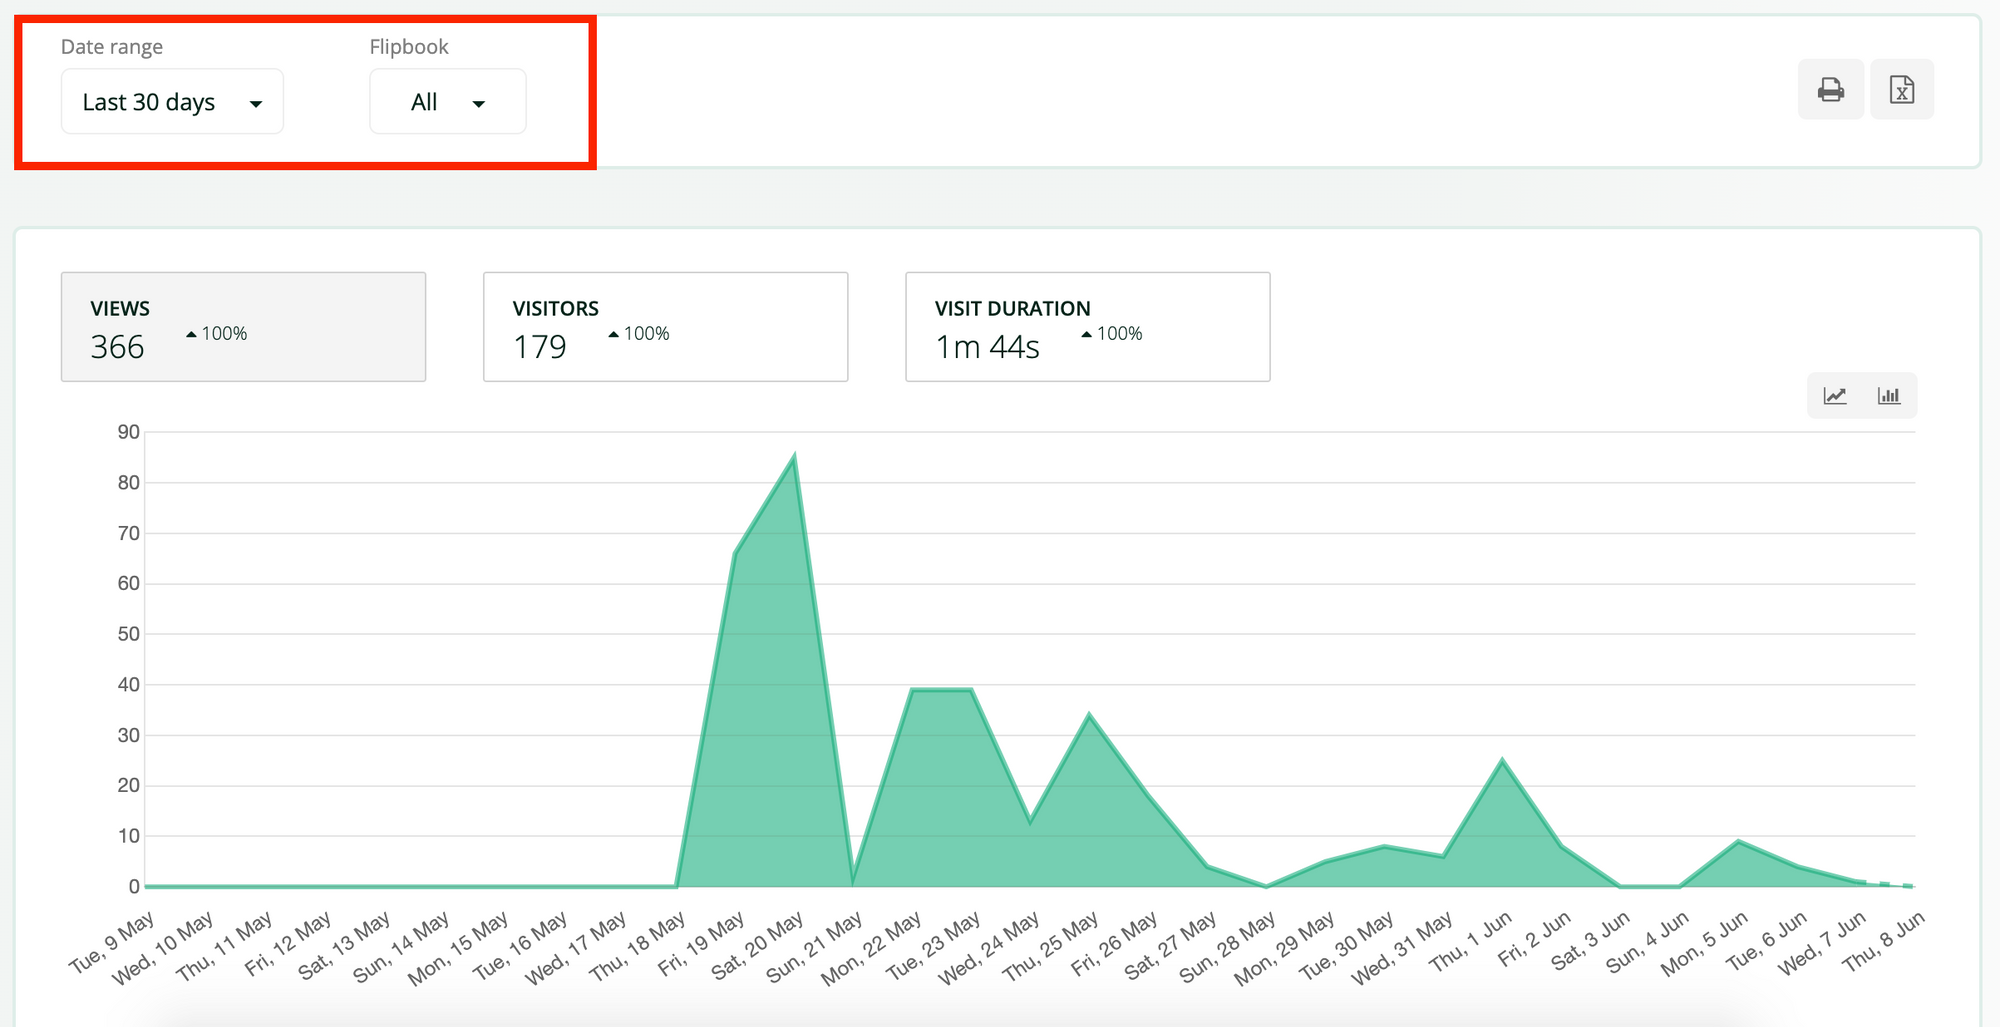
Once there, the first thing you can do with your stats is to filter them by time and publication.
To do this, you just have to choose the time frame you want to analyze and decide if you desire to see the data from all your documents, a flipbook tag, or just from one of them in particular.
When you do so, you will see three metrics appear in the first graph of your statistics:
- Views: This metric shows how many visits your document has received.
- Visitors: This metric shows how many visitors your document has received.
- Visit duration: This metric shows the average time spent on your document
So, if a user visits a flipbook 3 times, the statistics will show 3 views from 1 single visitor. The chart below will show you the evolution of your views, visitors, or visit duration over time. You only need to click the metric you are interested in.
How do I view stats per page?
If you scroll down toward the bottom of the statistics page, you will find a chart that ranks flipbooks by relevance according to the number of visitors, views, or visit duration. You can see from the TOP 5 to the TOP 20 publications. You can also choose to see this information in a bar chart or a pie chart with the button at the top-right corner.
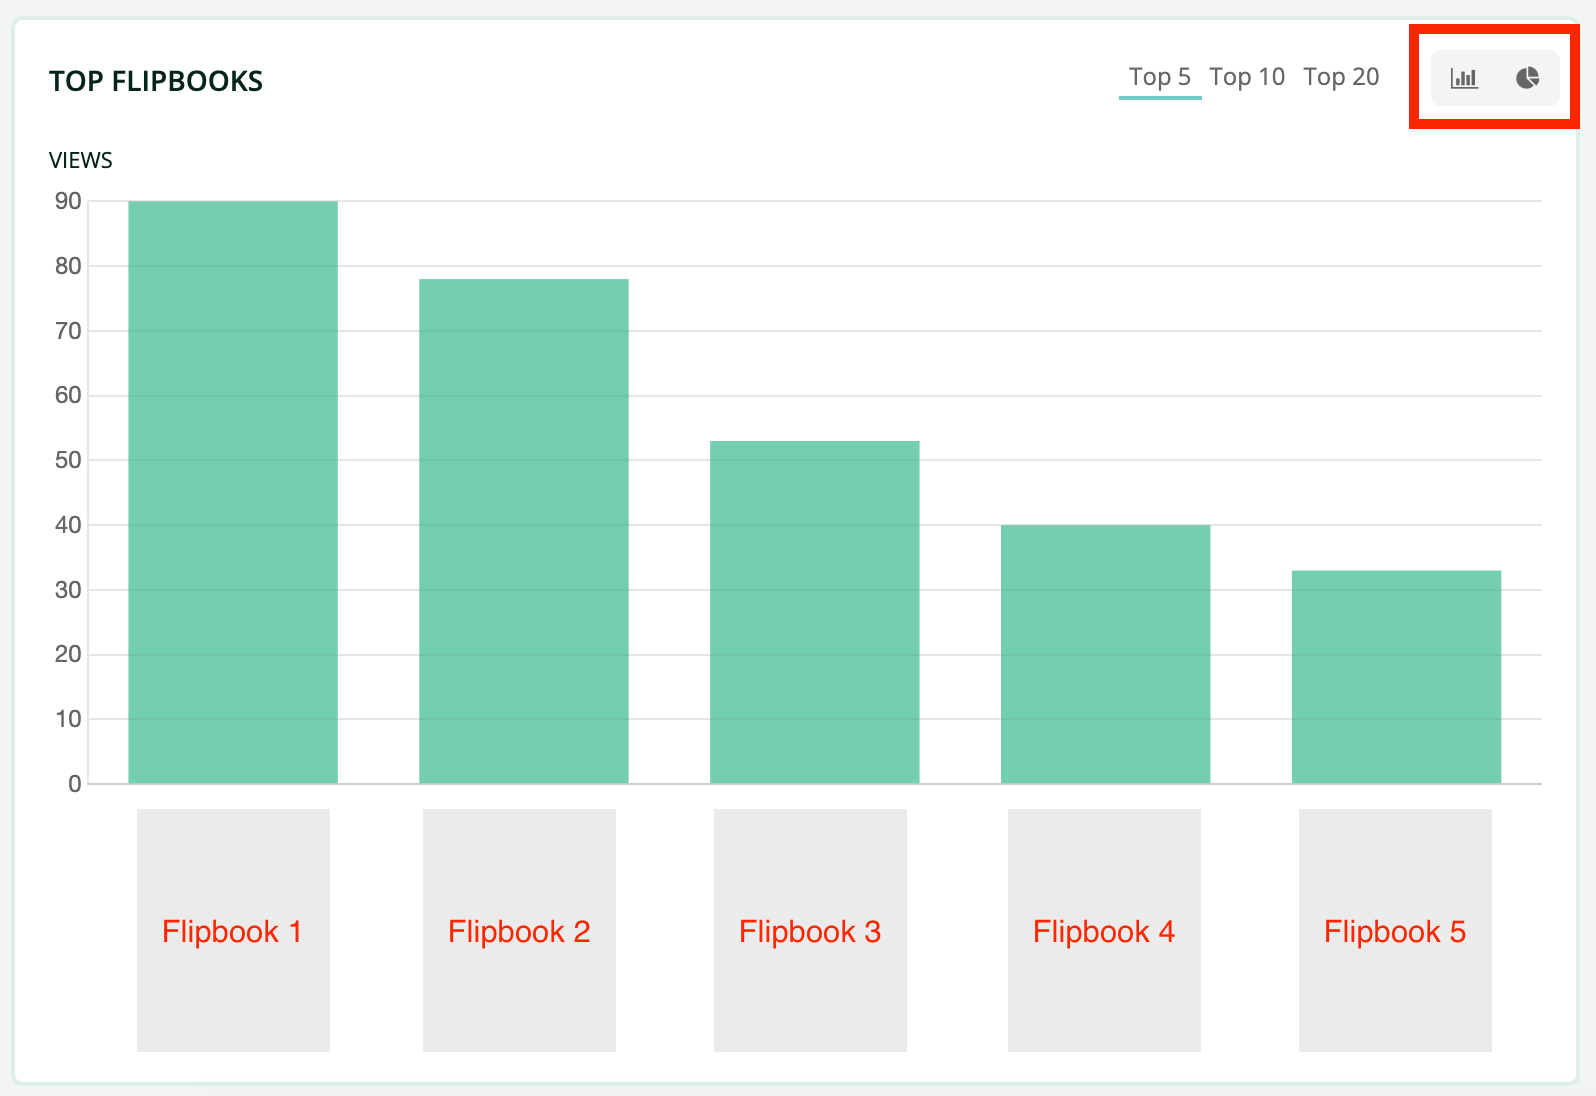
The information in this section changes depending on whether you have chosen to view the stats of a group of your flipbooks together or just one of them specifically.
If you have chosen this last option, or you click the bar, the chart will show the TOP Pages of that publication in particular according to the visitors, views, or visit duration it has received.
By changing the base metric and checking this panel, you can easily discover which pages are visited more often and which ones your audience is spending more time on. This will help you improve the most relevant content in your publication.
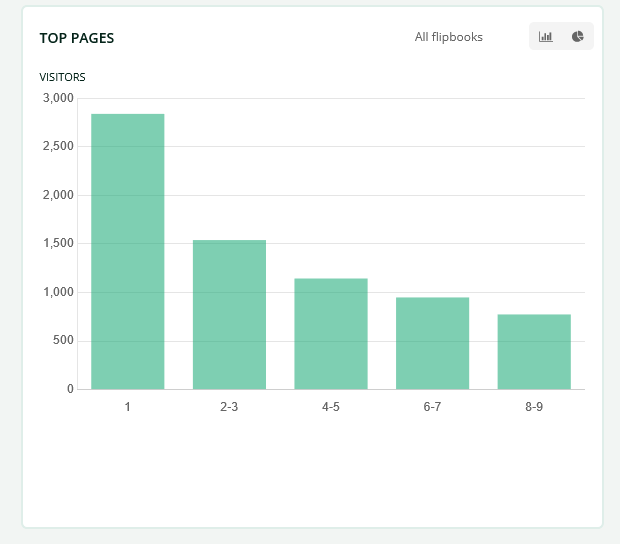
The graph typically has this shape where the first pages have more visitors than the last ones. It allows you to see where the big drops are and add or improve the content on these pages to get your audience to keep reading.
How do I know where my visitors are coming from?
Moving forward, on the right side of the screen, you will see a list that
shows information about the source of the visitors.
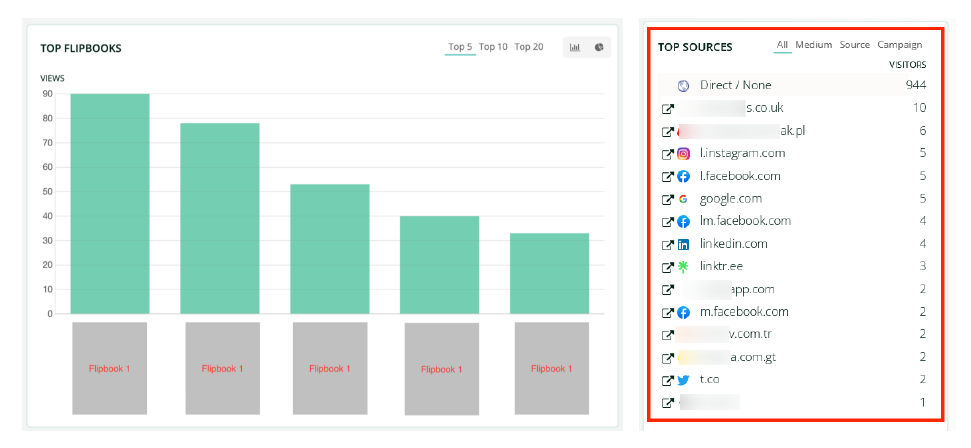
If you look closely at this chart, it allows you to break down the information into:
• Source: Is where your website's traffic comes from (individual websites, Google,
Facebook, Instagram, etc).
• Medium: This is how it got there (organic traffic, paid traffic, referral, etc).
• Campaign: It is the specific promotion or campaign you are offering to your
audience.
This feature is intended for those users who use UTMs in their flipbook links.
In case you don't know, a UTM is a set of parameters you can add to your links without altering the web, allowing you to collect extra information about your visitors. But let's see an example.
Imagine you have created a flipbook with your catalog of products that will be on sale for this year's Black Friday, and you have decided to share the flipbook link on your business social networks.
Using UTMs in your flipbook, you can simply add parameters to the link you share with your followers, for example:
https://mydomain.com/myflipbook.html?utm_medium=social&utm_source=facebook&utm_campaign=BlackFriday2023
Now when a visitor clicks this link you crafted, there will be a "social" item on the medium, a "facebook" item on the source, and a "BackFriday2023" item on the campaign panels on the stats page.
You can also filter the data by these parameters. So you can, for example, know how the campaign is performing over time and take action when needed.
How do readers interact with my documents?
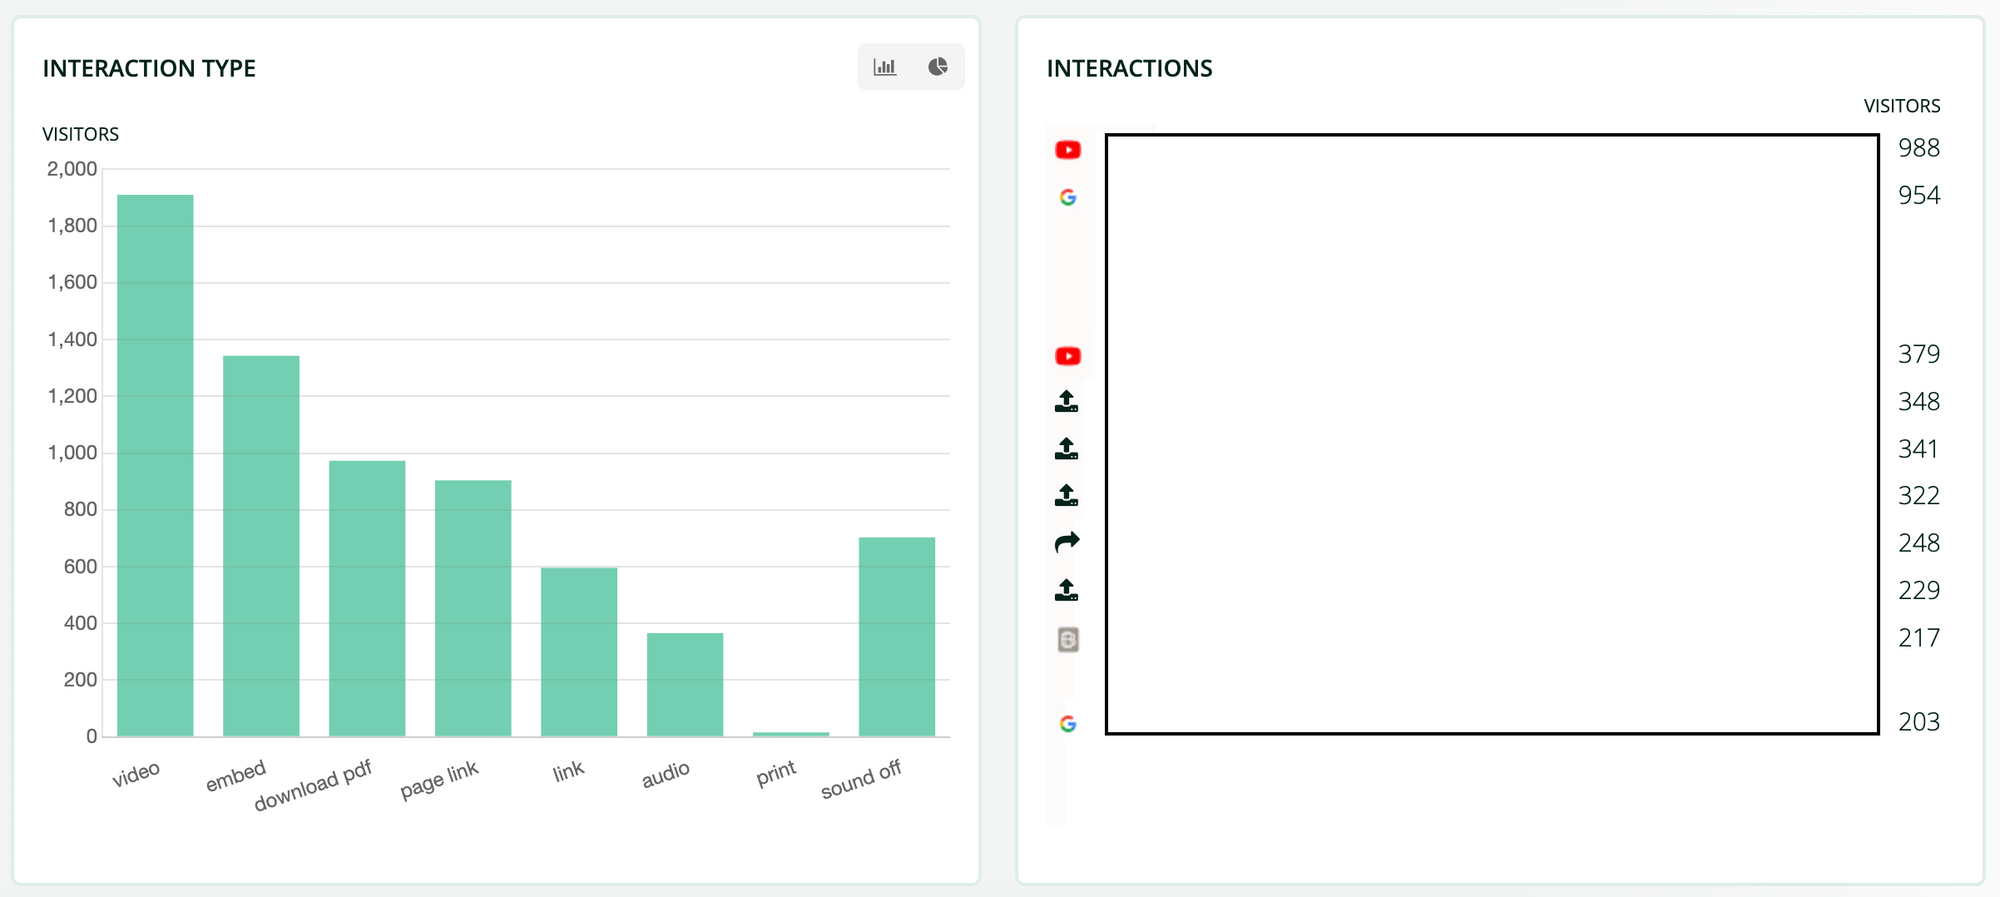
Now we know how visitors interact with a specific flipbook or a specific page in a document. But we can go deeper and see what exactly they are interacting with.
On the interaction type chart, we can see how many people have downloaded the PDF, watched videos, listened to audio, and so on with any of the interaction type you have added to a Heyzine flipbook.
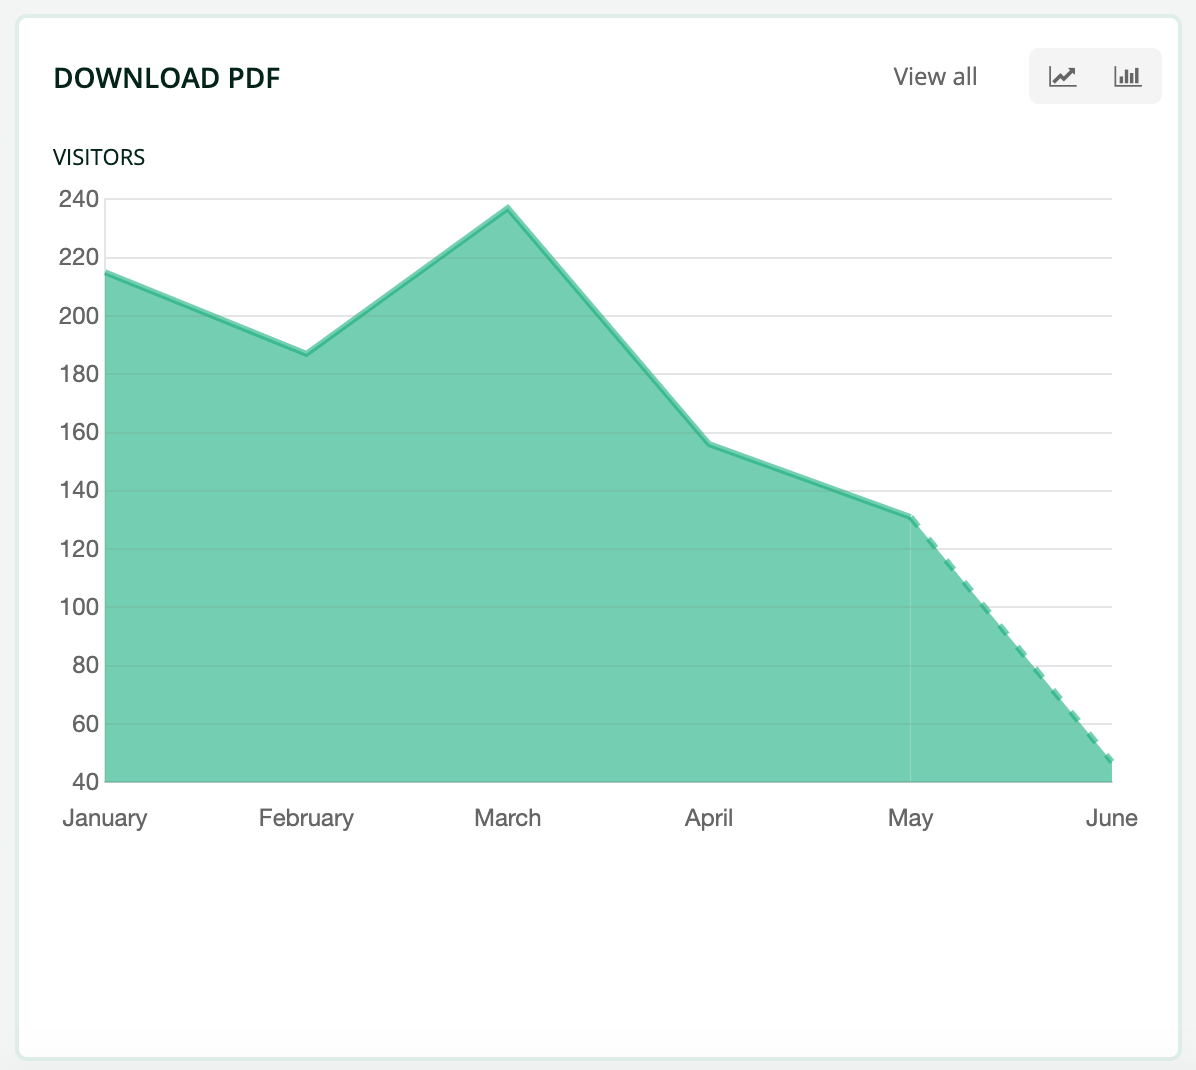
If you want more specific information on each interaction, you can click on the bar you are most interested in (e.g. downloads), and you will see the evolution of the PDF downloads over time.
On the right panel, you can also see the number of visitors for each specific link, audio, video, embed, and all the other hotspots.
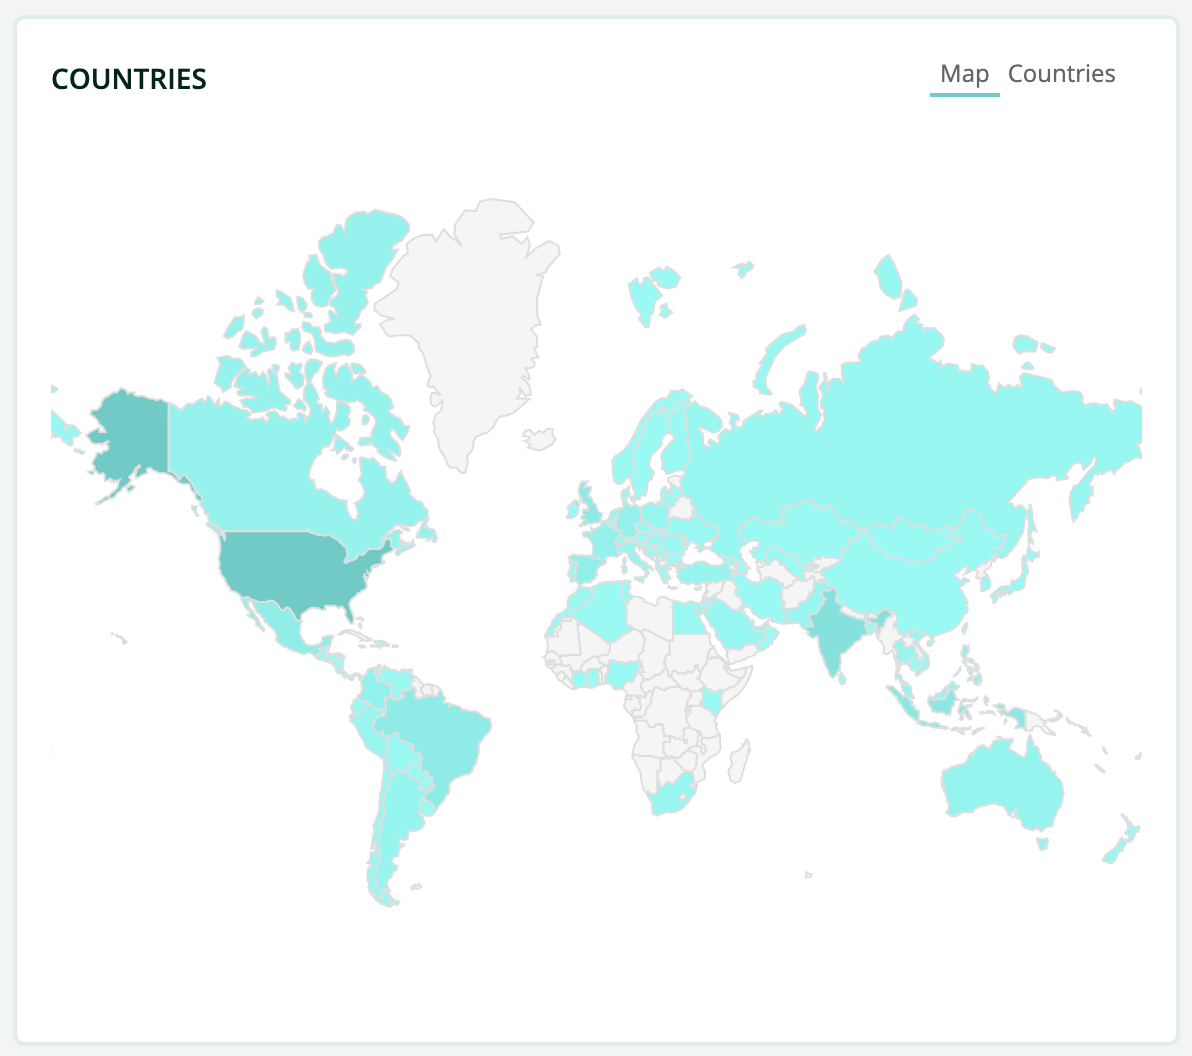
Lastly, at the end of the stats page, you can find a map to understand from which part of the world your visits are coming. And again, you can click it to filter all the information on the stats page and see the behavior of visitors from specific countries.
How can I export the data?
Going back to the top of your stats panel, you will see these two little buttons that allow you to export the information you want with a single click:
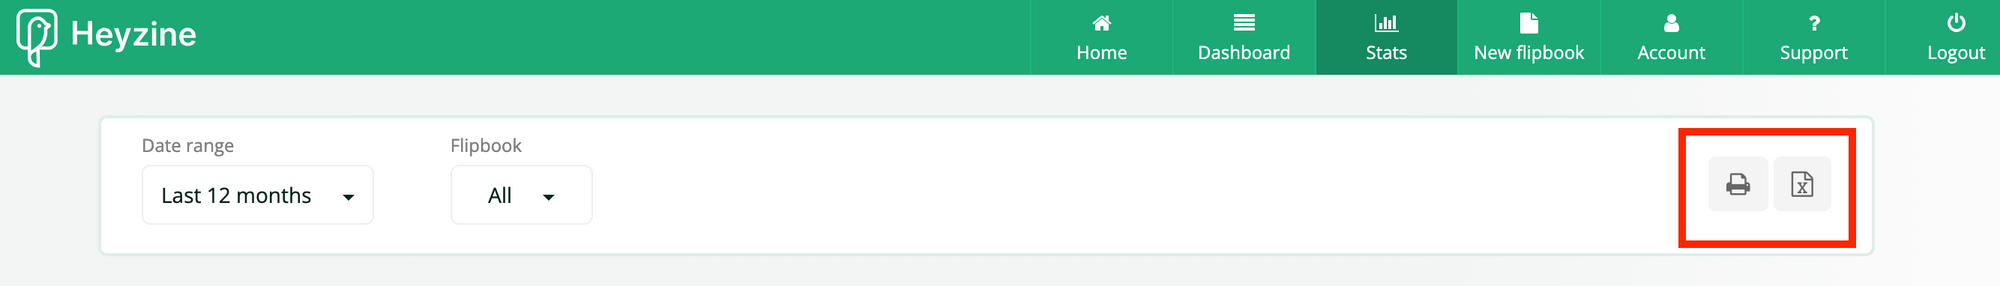
You can choose whether you want to get a PDF report or if you prefer to export the information in Excel format.
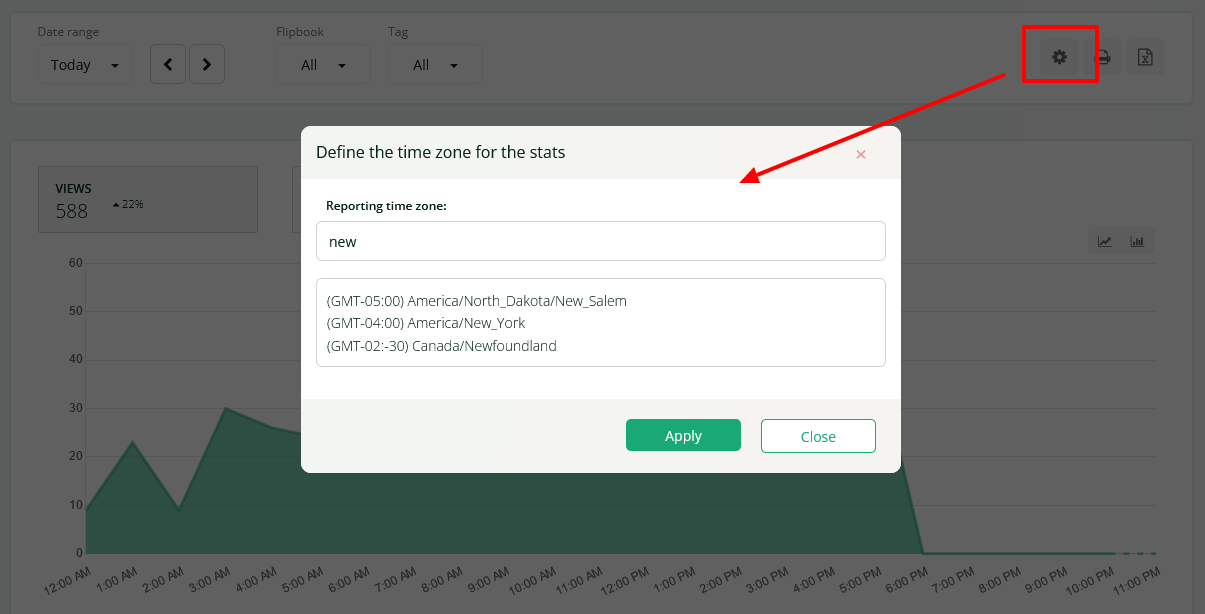
How can I define the time zone used in the reports?
When analyzing the visits of your publications, a key point is to determine how to group your visits in days and hours. In the most common and simplest case, you will simply define your time zone here.
When most of your visitors come from a different time zone, it is best to set their timezone, as this will help to more easily identify patterns, such as the days of the week with the most activity.
To do this, click on gear on the top-right menu, find the corresponding time zone by country and city, and click apply.
And that's it for this guide! If you don't want to miss a single detail about what's going on in your documents, take a look at it from time to time and monitor the evolution to keep making your content awesome.

